강사님 깃헙주소
https://github.com/joneconsulting/cloud-service
joneconsulting/cloud-service
Contribute to joneconsulting/cloud-service development by creating an account on GitHub.
github.com
gartner top technology trends 2021
https://www.aitimes.kr/news/articleView.html?idxno=18089
코로나 이후 2021년, 가트너 '9가지 전략기술' 발표... 인공지능, 분산클라우드, 인터넷오브액션 등
2021년 어느 날, 산업 현장의 직원들은 COVID-19 대유행 때 문을 닫은 후 다시 직장으로 돌아왔을 때, 그들은 몇 가지 차이점을 발견했다. 센서나 RFID 태그는 직원들이 정기적으로 손을 씻는지 여부
www.aitimes.kr
programming language ranking 2021
stackoverflow programming language ranking 2021
https://www.wearedevelopers.com/magazine/top-programming-languages-to-learn
Top in-demand programming languages to learn in 2021
Long-established languages such as Java, C, or JavaScript are usually the right choice for beginners. But are they still future-proof? These are the players of tomorrow that you should learn in 2021.
www.wearedevelopers.com
https://stackoverflow.blog/2020/05/27/2020-stack-overflow-developer-survey-results
The 2020 Developer Survey results are here! - Stack Overflow Blog
We're excited to share the results of our 10th annual developer survey! 65,000 developers shared their thoughts on the state of software today.
stackoverflow.blog
https://withhsunny.tistory.com/57
MAC 터미널 현재 위치에서 vscode 열기
You can also run VS Code from the terminal by typing 'code' after adding it to the path: 1. Launch VS Code. 2. Open the Command Palette (Ctrl+Shift+P) and type 'shell command' to find the Shell C..
withhsunny.tistory.com
맥 터미널에서 vs code 실행시키기
**학습한 내용
-
파이썬 프로그래밍(24h)
-
웹 스크래핑, 시각화, 데이터 분석(24h)
-
Request, BeautifulSoap, Seaborn, Pandas
-
Selenium
-
Scrapy
-
MariaDB 연동 (RDBMS)
-
django + bootstrap(32h)
-
git
-
postman
-
Pandas_exercise
SF Salaries Exercise
import pandas as pd
Read Salaries.csv as a dataframe called sal.
sal = pd.read_csv('Salaries.csv')
Check the head of the DataFrame.
sal.head(2)
Use the .info() method to find out fow many entries there are.
sal.info()
What is the average BasePay?
sal['BasePay'].mean()
What is the highest amount of OvertimePay in the dataset?
sal['OvertimePay'].max()
What is the job title of JOSEPH DRISCOLL? Note: Use all caps, otherwise you may get an answer that doesn't match up (there is also a lowercase Joseph Driscoll).
sal[sal['EmployeeName'] == 'JOSEPH DRISCOLL']['JobTitle']
How much does JOSEPH DRISCOLL make (including benefits)?
sal[sal['EmployeeName'] == 'JOSEPH DRISCOLL']['TotalPayBenefits']
What is the name of highest paid person (including benefits)?
sal[sal['TotalPayBenefits'] == sal['TotalPayBenefits'].max()]['EmployeeName']
sal.iloc[sal['TotalPayBenefits'].idxmax()]
What is hte name of lowest paid person (including benefits)? Do you notice something strange about how much he or she is paid
sal[sal['TotalPayBenefits'] == sal['TotalPayBenefits'].min()]
What was the average (mean) BasePay of all employees per year? (2011-2014) ?
sal.groupby('Year').mean()['BasePay']
How many unique job titles are there?
sal['JobTitle'].nunique()
What are the top 5 most common jobs?
sal['JobTitle'].value_counts().head(5)
How many Job Titles were represented by only one person in 2013? (e.g. Job Titles with only one occurence in 2013) ?
sum(sal[sal['Year'] == 2013]['JobTitle'].value_counts() ==1)
How many people have the word Chief in thier job title? (This is pretty tricky) (using lambda expression)
def chief_string(title: str) -> bool:
    if 'chief' in title.lower().split():
        return True
    else :
        return False
sum(sal['JobTitle'].apply(lambda x : chief_string(x)))
Bonus: Is there a correlation between length of the Job Title string and Salary?
sal['title_len'] = sal['JobTitle'].apply(len)
sal[['TotalPayBenefits', 'title_len']].corr()
2. Ecommerce Purchases Exercise
** Import pandas and read in the Ecommerce Purchases csv file and set it to a DataFrame called ecom. **
import pandas as pd
ecom = pd.read_csv('Ecommerce Purchases.csv')
Check the head of the DataFrame.
ecom.head(2)
** How many rows and columns are there? **
ecom.info()
** What is the average Purchase Price? **
ecom['Purchase Price'].mean()
** What were the highest and lowest purchase prices? **
ecom['Purchase Price'].max()
ecom['Purchase Price'].min()
** How many people have English 'en' as their Language of choice on the website? **
ecom[ecom['Language'] == 'en'].count()
** How many people have the job title of "Lawyer" ? **
ecom[ecom['Job'] == 'Lawyer'].info()
** How many people made the purchase during the AM and how many people made the purchase during PM ? ** *(Hint: Check out value_counts() ) *
ecom['AM or PM'].value_counts()
** What are the 5 most common Job Titles? **
ecom['Job'].value_counts().head(5)
** Someone made a purchase that came from Lot: "90 WT" , what was the Purchase Price for this transaction? **
ecom[ecom['Lot'] == '90 WT']['Purchase Price']
** What is the email of the person with the following Credit Card Number: 4926535242672853 **
ecom[ecom['Credit Card'] == 4926535242672853]['Email']
* How many people have American Express as their Credit Card Provider *and made a purchase above $95 ?**
ecom[(ecom['CC Provider'] == 'American Express') & (ecom['Purchase Price']>95)].count()
** Hard: How many people have a credit card that expires in 2025? **
sum(ecom['CC Exp Date'].apply(lambda x : x[3:]) == '25')
** Hard: What are the top 5 most popular email providers/hosts (e.g. gmail.com, yahoo.com, etc...) **
ecom['Email'].apply(lambda x : x.split('@')[1]).value_counts().head(5)
Great Job!
3. convenient_stat
%matplotlib inline
import pandas as pd
import matplotlib as plt
##1. csv 파일 불러오기 (convenient_store.csv)
con = pd.read_csv('convenient_store.csv')
con.head(5)
##2. 전체 컬럼 정보, null 값 유무 확인
con.info()
##3. 개수, 평균, 편차, 최소, 최대값 확인
con.describe()
##4. 지역에 대한 통계, 개수, 유니크한 정보, 제일 빈도가 높은 지역
# con['area']
con.area.describe()
##5. 시간 당 급여가 6500원 이상인 지역의 편의점 정보 출력 (상위 10개만)
con[con['hourly_wage']>=6500].head(10)
##6. 시간 당 급여가 높은 순서로 정렬 (sort_value() 함수 사용, 상위 10개만 출력)
con.sort_values(by='hourly_wage', ascending=0).head(10)
##7. 영등포구에서 시간 당 급여가 6000원 이상인 편의점 검색
con[((con['area'].apply(lambda x : x[:4])) =='영등포구') & (con['hourly_wage']>=6000)]
##8. CU 편이점만 출력 (상위 10개만)
con[con.company.str.contains('CU')].head(10)
##9. 지역 컬럼(location)을 추가한 다음, in Seoul 이라는 값 저장, 상위 5개 출력
con['location'] = 'in Seoul'
con.head(5)
##10. 6000원 이상 컬럼 추가(more_than_6000) -> True, False 값 저장 (상위 20개 출력)
con['more_than_6000'] = con.hourly_wage>6000
con.head(20)
##11. more_than_6000 컬럼에서 True인 데이터들의 평균, 개수, 편차 등의 정보 출력
con[con.more_than_6000==True].describe()
##12. more_than_6000 이름의 함수를 생성하고, 6000원이상인 경우 A group, 아니면 B group을 반환하는 함수 생성
def more_than_6000(x: int)-> int:
    if x >= 6000:
        return 'A group'
    else:
        return 'B group'
##13. more_than_6000_f 컬럼 생성하고 more_than_6000 함수의 결과를 저장
con['more_than_6000_f'] = con.hourly_wage.map(lambda x: more_than_6000(x))
##14. 지금까지의 결과 상위 10개를 출력
con.head(10)
##15-1. more_than_6000가 True인 데이터의 지역과 시간당 급여를 가진 새로운 데이터프레임 생성(data2)
##15-2. data2 데이터를 시간당 급여 순으로 정렬 (높은순)
data2 = con[con['more_than_6000'] == True][['area1','hourly_wage']]
data2.sort_values(by='hourly_wage', ascending=0)
##16. data2를 darta2.csv 파일로 저장
data2.to_csv('data2.csv', index=False)
##17. 시간당 급여를 histogram 으로 표시 (matplotlib hist() 사용)
con.hourly_wage.hist(bins=10)
plt.pyplot.show()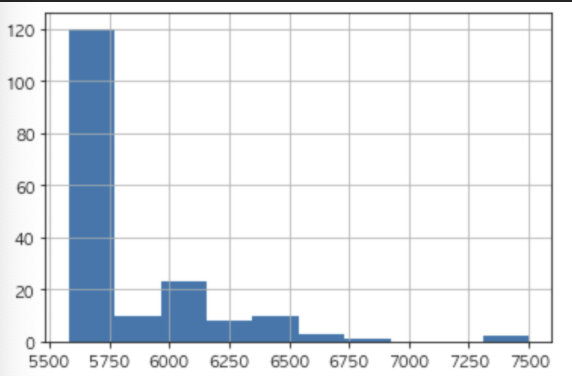
##18. 시간당 급여를 box 차트로 표시
con.boxplot(column='hourly_wage', return_type='dict')
##19. 시간당 급여를 box 차트로 표시(이름순으로)
con.boxplot(column='hourly_wage', by='name')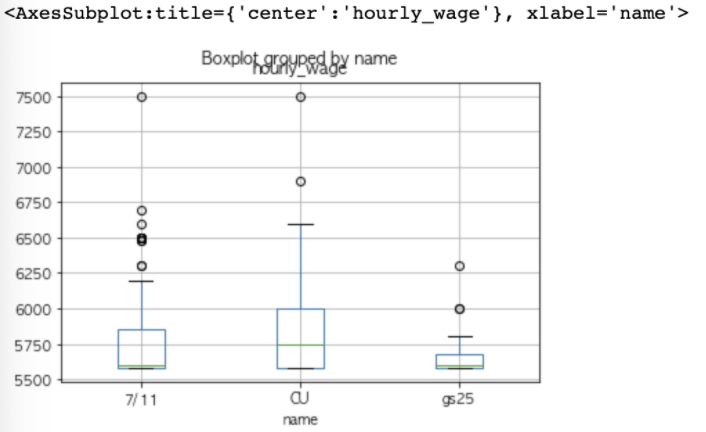
##19. 시간당 급여를 box 차트로 표시(지역순으로)
con.boxplot(column='hourly_wage', by='area1')

##20. 한글 표시되게 matplotlib 지정
#강사님버전
import matplotlib.font_manager as fm
font_list = [(f.name, f.fname) for f in fm.fontManager.ttflist if 'Gothic' in f.name]
print(font_list)
font_name = fm.FontProperties(fname='/System/Library/Fonts/Supplemental/AppleGothic.ttf').get_name()
print(font_name)
plt.rc('font', family=font_name)
[('Noto Sans Gothic', '/System/Library/Fonts/Supplemental/NotoSansGothic-Regular.ttf'), ('Apple SD Gothic Neo', '/System/Library/Fonts/AppleSDGothicNeo.ttc'), ('Hiragino Maru Gothic Pro', '/System/Library/Fonts/ヒラギノ丸ゴ ProN W4.ttc'), ('AppleGothic', '/System/Library/Fonts/Supplemental/AppleGothic.ttf')]
AppleGothic
#참고버전
from matplotlib import rc

rc('font', family='AppleGothic')
plt.rcParams['axes.unicode_minus'] = False
##22-1. 지역구별 box 차트(플롯)
##22-2. 폰트 사이즈 6
con.boxplot(column='hourly_wage', by='area')
plt.pyplot.xticks(fontsize=6)
##23-1. 지역구별 box 차트(플롯), 지역구가 세로로 표시
##23-2. 폰트 사이즈 6
con.boxplot(column='hourly_wage', by='area1', vert=False)
plt.pyplot.xticks(fontsize=6)
**Selenium
-
웹 애플리케이션 테스트 프레임워크
-
웸 사이트에서 버튼 클릭과 같이 이벤트 처리 가능
-
JavaScript 실행 가능
-
웹 브라우저 실행을 대신하기 위한 Web Driver 설치 -> Selenium이 사용하기 위한 웹 브라우저
- http://chromedriver.chromium.org/downloads
Downloads - ChromeDriver - WebDriver for Chrome
WebDriver for Chrome
chromedriver.chromium.org
-
$pip install selenium
-
input 태그에 name이나 id같은 선택자가 있으면 selenium에서 테스트가능
**Scrapy
-
수많은 웹 페이지로부터 정보를 수집 -> 빅데이터로 활용
-
Scrapying을 위한 라이브러리
-
$pip install scrapy
-
Scrapy Shell
-
$scrapy shell
(pip install --upgrade setuptools
pip install pypiwin32
pip install twisted)
pip install scrapy
scrapy shell
fetch('https://news.naver.com/main/list.nhn?mode=LSD&mid=sec&sid1=001')
view(response)
print(response.text)
'CLOUD > Python' 카테고리의 다른 글
| 1/19 웹크롤링 - selenium, scrapy, 여러페이지 크롤링 (2) | 2021.01.19 |
|---|---|
| 1/11 파이썬 6차시 - 웹스크래핑(MariaDB연동), 시각화 (0) | 2021.01.11 |
| 1/6 파이썬 5차시 - 웹스크래핑(csv, xml, json타입 처리), 데이터 분석 (0) | 2021.01.06 |
| 1/5 파이썬 4차시 - 깃파이참연동, 모듈과 패키지, 예외처리, 파일다루기, 웹스크래핑 (0) | 2021.01.05 |
| 1/4 파이썬 3차시 - 함수가이드라인, pythonic code, 람다, 객체와클래스, 모듈과 패키지 (0) | 2021.01.04 |